Get ahead
VMware offers training and certification to turbo-charge your progress.
Learn moreNot too long ago, I introduced DSL descriptors (DSLDs) for Groovy-Eclipse. DSLDs are Groovy scripts that provide rich editing support (content assist, navigation, etc.) for Groovy projects in your Eclipse workspace. Since DSLDs can only be executed inside a running Eclipse process, debugging is not as simple as firing up the Eclipse debugger and stepping through a Groovy script. In this post, I'll describe some simple and some more complex techniques that you can use for debugging your DSLDs.
To get all of this working, you will need the latest development builds:
The simplest and crudest way to debug your DSLDs is by using println. This will print expressions to the standard out of the running Eclipse process, which can be seen if you launched your Eclipse from the command line. However, I recommend using a log statement instead. This will print logging information to the Groovy event console.
As you can see in the example below, every time the pointcut in MethodParams.dsld matches, the current value of vals will be printed to the Groovy event console.
The log method may be used anywhere in a DSLD script. All log entries in the event console are prefixed with "======". The Groovy event console will also display your script's compilation errors and exceptions thrown, so it is quite useful even if the DSLD script does not contain any log statements.
When not using the event console, it is better to keep it closed, since the trace can get large quickly and wind up consuming significant memory and processing power.
Print and log statements only have limited use. It is possible to get proper debug support for your DSLDs with the ability to set breakpoints, step through code, and perform debug evaluations. Even though the set-up is a bit involved, this may be worthwhile when debugging complex scripts. Essentially, you need to launch a new instance of Eclipse (a runtime workbench) in your Eclipse debugger and debug your script through there. There is a lot of information available about creating and using Eclipse runtime workbenches, but most of that is not necessary for DSLD debugging.
Here are the required steps:
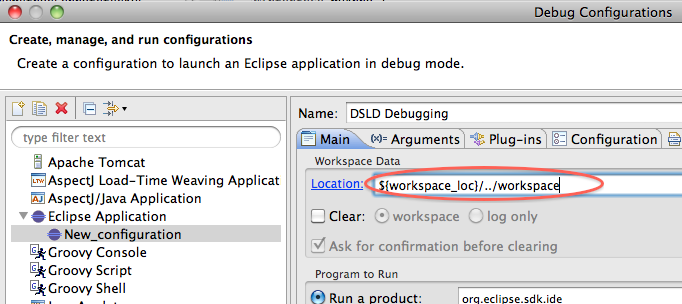
 Then create a new launch configuration by double-clicking on Eclipse application. In the Workspace Location section, choose the filesystem directory of the workspace containing your DSLD:

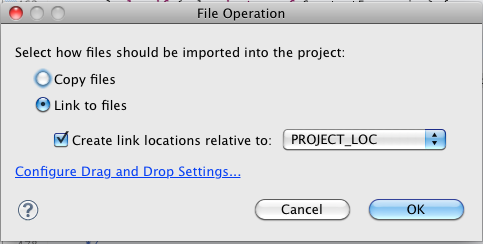
 Make sure to choose link. A linked file will ensure that changes made in one workspace will be reflected in the other. I recommend dragging and dropping (instead of other ways of importing the file into your workspace) because it is the easiest way to ensure that your file is linked instead of copied.
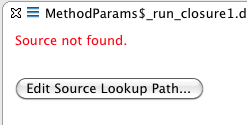
 You must explicitly add the newly created Groovy project to the source lookup path of the Eclipse runtime launch configuration. And once you do, the source code will be available.
And if you have STS, you can perform evaluations in the expressions view:

And in the editor, select an expression and do CTRL-Shift-I, or CMD-Shift-I (in this case names):
Note that closures are not allowed in evaluations and Groovy debug evaluations must be explicitly enabled in the Groovy -> Debugger -> Extended Debugging Support page:
Using this method to debug your DSLD scripts will help you create larger scripts to support more sophisticated Groovy DSLs.